90 Day QR Pilot to Prove Loyalty Program ROI for CFOs
90 Day QR Pilot to Prove Loyalty Program ROI for CFOs

Loyalty programs generate positive ROI more often than not, but only when you measure incremental net profit against a control group instead of counting every dollar members spend. The single rule that separates a defensible business case from wishful thinking: isolate what members would have bought anyway, subtract full program costs, and report the difference. Start there, and your first move should be a scoped 90-day pilot with a genuine holdout group.
TL;DR:
- Loyalty programs typically produce positive ROI when measuring incremental net profit versus a control group, not total member spending.
- Key KPIs include retention lift, purchase frequency, and redemption rates, with low redemption often indicating friction rather than disinterest.
- A 90-day pilot using random holdouts and control groups helps eliminate bias and provides a realistic picture of program impact before scaling.
- Calculating true ROI requires accounting for complete costs, including technology, rewards liability, staff time, and marketing, with estimates adjusted regularly.
- External market shifts and seasonal variations can affect program performance, so ongoing recalibration of the model is essential for accurate ROI assessment.
Table of Contents
- How Do You Calculate Loyalty Program ROI?
- Which KPIs Actually Prove Loyalty Program Effectiveness?
- What Costs Belong in a Loyalty Program’s Total Cost of Ownership?
- How Do You Measure Incremental Impact Without Bias?
- What Are the Five Financial Levers Behind Loyalty ROI?
- What ROI Timeline Should You Expect From a Loyalty Program?
- What Mistakes Undermine Loyalty Program ROI Calculations?
- How QR-Based Loyalty Programs Fit the ROI Playbook
- How Do Market Conditions Affect Loyalty Program ROI?
- How Should You Optimize a Loyalty Program Based on ROI Data?
- How Does Loyalty ROI Calculation Differ Across Industries?
- Getting Started: A Practical Recommendation
- Run Your Pilot on a Platform Built for This Exact Playbook
- Sources
- FAQ
How Do You Calculate Loyalty Program ROI?
The formula finance teams actually trust is:
ROI = (Incremental net profit − Program cost) / Program cost × 100
Vendor frameworks and practitioner guides converge on this version because it forces you to isolate incremental revenue rather than gross member spend, a distinction most loyalty pitches quietly skip, according to Talon.One’s ROI framework. Incremental revenue is member revenue minus what a matched control group (non-members with similar purchase history) spent over the same period. If your members spent $50 more per quarter and your control group’s purchases stayed flat, that $50 gap is your incremental figure, not the member’s total spend.
Here’s a simplified worked example:
- 1,000 enrolled members generate $220 average quarterly spend
- A matched control group of 1,000 non-members averages $185 over the same quarter
- Incremental revenue per member: $35, or $35,000 across the cohort
- Apply a 35% gross margin to isolate incremental net profit: $12,250
- Program cost for the quarter (platform fees, rewards redeemed, staff time): $6,000
- ROI = ($12,250 − $6,000) / $6,000 × 100 = 104%
That number only holds up if the cost side is complete and the control group is genuinely comparable. OpenLoyalty’s ROI worksheet walks through similar stepwise calculations using member count, average order value, and purchase frequency as inputs, which is a useful cross-check before you present numbers internally.
Which KPIs Actually Prove Loyalty Program Effectiveness?
Finance doesn’t want a dashboard full of vanity metrics. It wants numbers that map cleanly to revenue and margin, and a handful of KPIs do that job better than the rest.
- Customer lifetime value (CLV): total projected net profit from a customer relationship; track the delta between member and non-member cohorts, not the absolute number.
- Retention lift: the percentage-point difference in repeat-purchase rate between members and a matched control group over a fixed window.
- Average order value (AOV): compare member AOV to control AOV, not member AOV to your historical baseline, which conflates loyalty effects with seasonality.
- Purchase frequency: transactions per member per period, again benchmarked against control.
- Redemption rate: the share of issued rewards actually redeemed; low redemption often signals friction, not lack of interest.
- Engagement rate: scan, check-in, or app-open frequency, useful as a leading indicator but weaker as a standalone ROI proof point.
A meta-analysis covering effect sizes from 1990 through 2020 found loyalty programs reliably move behavioral loyalty (what people actually buy) but produce far more mixed results on attitudinal loyalty (what people say they feel), according to research published in the Journal of the Academy of Marketing Science. That’s the practical argument for anchoring your ROI case in behavioral metrics like retention and frequency rather than satisfaction surveys.
Statistic to remember: the EY Loyalty Market Study found many well-measured programs now report positive ROI, often in the moderate range, with organizations increasingly tracking both direct revenue impact and indirect signals like reduced churn.
To translate a KPI lift into dollars, run the math the same way each time: take the percentage-point difference between member and control cohorts, multiply by cohort size and average transaction value, then apply margin. A 5-percentage-point retention lift across 2,000 members with a $60 average transaction and four purchases a year translates to roughly $24,000 in incremental annual revenue before margin. That’s the kind of number a CFO can interrogate line by line.
What Costs Belong in a Loyalty Program’s Total Cost of Ownership?
Most ROI calculations fail not because the revenue side is wrong, but because the cost side is incomplete. A defensible model accounts for four categories.
- Technology: platform subscription or licensing fees, integration costs with your POS or e-commerce stack, and any one-time implementation fees amortized over the program’s expected life.
- Rewards liability: the value of points or discounts issued, adjusted for breakage (the share of rewards never redeemed). Model breakage conservatively; assuming too high a breakage rate flatters your ROI and creates a nasty surprise when redemption spikes.
- Operations: staff time spent administering the program, training frontline employees on redemption processes, and customer service tickets related to loyalty issues.
- Marketing: campaign costs to promote enrollment, email or SMS sends tied to loyalty communications, and any paid acquisition specifically targeting program sign-ups.
Points issuance should sit on your books as a liability the moment you issue it, not the moment it’s redeemed. Many teams also undercount non-obvious costs like customer service overhead and marketing tied specifically to loyalty campaigns, which skews the business case toward an inflated ROI figure, according to PRODATA’s cost analysis guide.
The costs teams forget most often: staff time spent troubleshooting redemption issues, fraud losses from coupon abuse or fake accounts, and the ongoing maintenance of integrations as your POS or CRM systems update. A quick way to estimate staff time is to log actual hours for one month and multiply by loaded hourly cost. For fraud, start with a conservative 1% to 2% of rewards value and adjust once you have real data.
How Do You Measure Incremental Impact Without Bias?
Two designs remove the guesswork: matched control groups and random holdouts. A matched control group pairs enrolled members with non-members who share similar acquisition source, prior spend, and purchase frequency, then compares outcomes over the same window. A random holdout goes a step further by randomly excluding a subset of otherwise-eligible customers from the program entirely, which eliminates selection bias since enrollment itself isn’t a choice being made by more or less engaged customers.
Selection bias is the quiet killer of loyalty ROI claims. Customers who opt into a program are often already your most engaged buyers, so comparing their spend to your average customer overstates the program’s actual effect.
Here’s a practical blueprint for a 90-day pilot:
- Segment selection (Days 1 to 7): Pick one customer segment (new customers, or a specific location if you operate multiple sites) rather than testing everyone at once.
- Random holdout assignment (Days 1 to 7): Randomly withhold 10% to 20% of eligible customers from enrollment, matched on acquisition source, prior 90-day spend, purchase frequency, and average order value.
- Baseline capture (Days 1 to 14): Record pre-pilot spend, frequency, and retention for both groups to confirm they’re genuinely comparable before the test starts.
- Mid-pilot check (Day 45): Review early engagement and redemption signals; this isn’t your go/no-go point, but it flags data quality issues early.
- Full measurement window close (Day 90): Compare incremental revenue, retention lift, and redemption rate between member and holdout groups.
- Go/no-go decision: If incremental net profit exceeds program cost with a reasonable margin, extend the pilot to a larger segment. If it’s negative or marginal, diagnose whether the issue is reward value, redemption friction, or program awareness before scaling further.
Sample size matters more than most teams assume. A pilot with fewer than a few hundred customers per group will struggle to detect a real effect against normal spending variance, so favor a longer window or a larger segment over a shorter, thinner test.
Pro Tip: If you can’t build a true random holdout because of technical or contractual constraints, use a matched comparison group instead and apply a conservative attribution fraction, commonly 25% to 45% of the observed spending gap, then commit to replacing that estimate with real holdout data within 12 months, according to Brandmovers’ calculation framework.
What Are the Five Financial Levers Behind Loyalty ROI?
A CFO-ready model breaks program impact into five distinct levers rather than one blended revenue number, because each lever has a different cost driver and a different timeline to materialize.
- Retention lift: fewer customers churning means more repeat revenue without added acquisition spend.
- AOV lift: members often add items to hit reward thresholds, a measurable and immediate effect.
- Purchase frequency lift: shorter gaps between visits or orders, typically the slowest lever to move but the most durable once it does.
- CAC reduction via referrals: members who share or tag your business on social platforms lower your blended customer acquisition cost.
- First-party data value: loyalty enrollment gives you permissioned contact and purchase data that reduces reliance on paid channels over time, a benefit that’s real but harder to quantify precisely.
Building a three-year model means projecting each lever’s dollar impact by year, then plotting cumulative revenue against cumulative cost to find your payback period. A typical structure: Year 1 costs run ahead of returns while you cover implementation and ramp-up, the two lines cross somewhere between month 12 and 18, and Years 2 and 3 show growing net positive cash flow as retention compounds.
Benchmark to anchor your model: industry aggregation from Brandmovers’ 2026 CFO-ready template puts average revenue-to-cost ratios for formally measured programs around 5.2x, though that figure spans a wide range of industries and program maturities, so treat it as a reference point rather than a target.
When you present this to finance, show a base case, a conservative case, and an upside case side by side rather than a single point estimate.
What ROI Timeline Should You Expect From a Loyalty Program?
Realistic benchmarks matter more than optimistic ones when you’re asking finance to fund a program. Industry sources describing common ROI ranges put many measured programs somewhere between 2x and 5x revenue-to-cost over a multi-year horizon, with wide variation by industry, according to Bon Loyalty’s benchmark research. Treat any single number as directional rather than a guarantee for your specific business.
The typical trajectory looks like this:
- Year 1: Costs often outpace returns as you cover implementation, staff training, and initial member acquisition; ROI frequently sits near breakeven or slightly negative.
- Months 12 to 18: Most programs cross into positive cumulative ROI as retention and frequency effects compound and one-time setup costs stop recurring.
- Years 2 and 3: Returns typically strengthen as the member base matures and first-party data starts reducing acquisition costs elsewhere in the business.
When you walk into a finance review, five things need to be on the table: the incremental revenue figure with its control-group methodology, the payback-period calculation, a scenario table showing base/conservative/upside cases, a sensitivity analysis on your two or three riskiest assumptions, and a governance plan for who owns ongoing measurement. Skip any of these and expect the meeting to end in more questions than approvals.
What Mistakes Undermine Loyalty Program ROI Calculations?
The same handful of errors show up in nearly every flawed loyalty business case, and most are fixable within a month or two once you know what to look for.
- Counting total member revenue instead of incremental revenue: this is the single biggest inflator of ROI claims, since it credits the program for spend that would have happened anyway.
- Undercounting costs: leaving out staff time, fraud losses, or marketing spend tied to loyalty communications makes the ROI look better than it is.
- Measuring over too short a window: 30-day snapshots miss slower-moving levers like purchase frequency and retention.
- Selection bias: comparing enrolled members to your average customer rather than a matched or randomized comparison group.
The fixes are straightforward: implement a holdout group even if it’s small, extend your measurement window to at least one full quarter, segment your reporting by acquisition channel and customer tenure, and default to conservative attribution when a true control group isn’t feasible yet.
Pro Tip: If you need a 30 to 60 day quick win, start by segmenting your existing reporting into member versus non-member cohorts using data you already have, even without a formal holdout. It won’t be perfect, but it beats reporting gross member revenue as if it were all incremental.
How QR-Based Loyalty Programs Fit the ROI Playbook
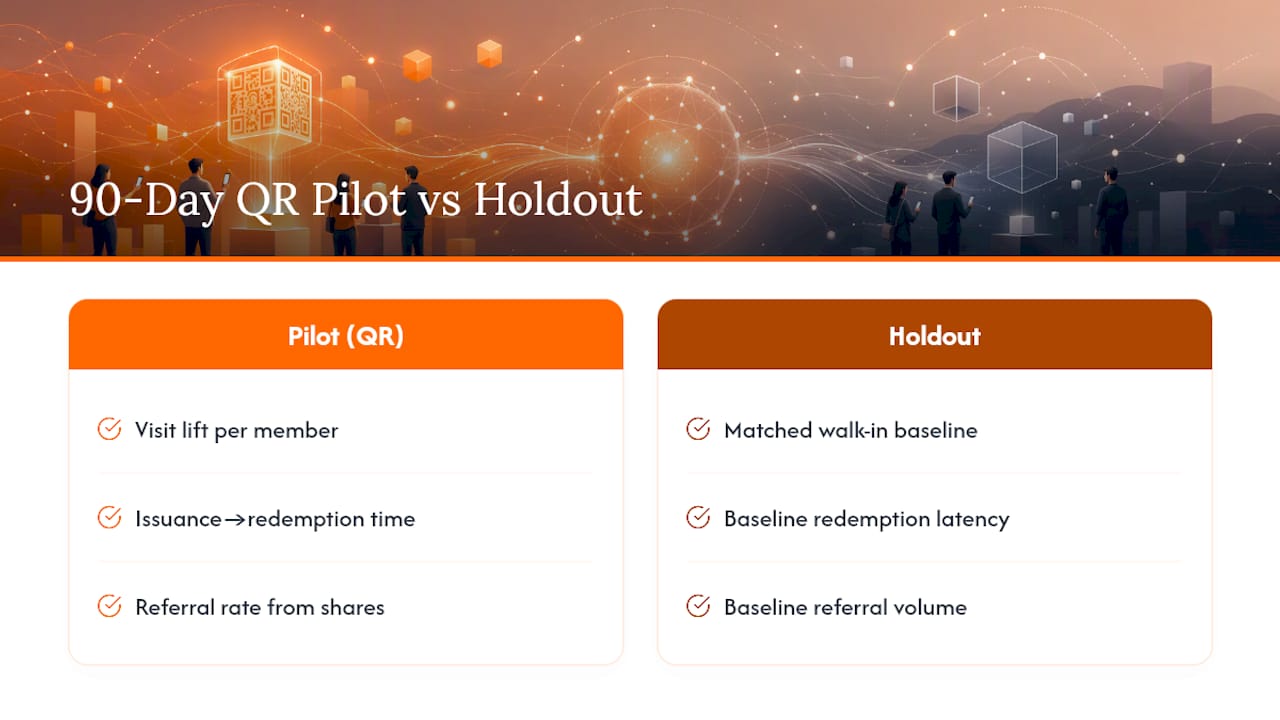
App-free, QR-driven programs like Getrewardqr move a specific subset of the KPIs covered above: visit frequency, redemption latency, and social referral volume. Because the entire loop, scan, follow, share, redeem, happens in under a minute without an app download, friction drops sharply compared to app-based programs, and faster redemption has been linked to closing the gap between how valuable members perceive a program and how it actually performs, according to EY’s loyalty study.
For a local business piloting this model, three pilot metrics matter most: visit lift per member compared to a matched control group of walk-in customers, average time from reward issuance to redemption, and the referral rate generated by social shares tied to each scan. A gym or salon running a 90-day pilot should track these against a holdout segment of customers who aren’t offered the QR campaign, using the same control-group discipline outlined earlier in this guide.
How Do Market Conditions Affect Loyalty Program ROI?
External conditions shift what a loyalty program can realistically deliver, and ignoring them leads to unrealistic year-over-year comparisons. If a competitor launches an aggressive discount program in your category, your retention lift may compress even if your program’s underlying design hasn’t changed, simply because customers have a new comparison point.
Broader consumer behavior shifts also matter. Inflation-sensitive periods tend to make reward value more salient. Customers scrutinize whether points and discounts actually offset rising prices, which raises the bar for what counts as a compelling offer. Economic downturns often increase price sensitivity, which can boost enrollment (people want the discount) while simultaneously compressing your margins on redeemed rewards.
Seasonality distorts short-window comparisons too. A retail loyalty program measured only through a holiday quarter will look artificially strong; the same program measured through a slow season might look weak by comparison, even with no actual change in program effectiveness. This is another reason to run your control-group comparison over the same calendar window for both member and non-member cohorts, so seasonal effects cancel out rather than get misattributed to the program.
Practical response: revisit your reward structure and messaging when you notice a shift in competitor activity or broader spending patterns, and rerun your incremental-revenue calculation on a rolling basis rather than treating your initial pilot numbers as permanent. A model built on data from a stable market period needs recalibration once conditions change.
How Should You Optimize a Loyalty Program Based on ROI Data?
Ongoing optimization works best when it’s driven by the specific KPI that’s underperforming, not by a general instinct to “improve engagement.” If redemption rate is low, the fix usually isn’t a bigger reward, it’s reducing the steps between earning and redeeming. If AOV lift is flat, look at whether your reward thresholds are set too high or too low relative to typical basket size.
Segment your ROI analysis by customer tenure and acquisition channel at least quarterly. A program that performs well for long-tenured customers but poorly for recent sign-ups points to an onboarding or early-engagement problem, not a fundamental flaw in the reward structure.
Test one variable at a time. Changing your reward tiers, your redemption process, and your marketing messaging simultaneously makes it impossible to know which change drove any resulting shift in the numbers. Run sequential, small-scale tests within your existing measurement framework rather than overhauling the whole program at once.
Revisit your cost assumptions on the same cadence as your KPI review. Breakage rates, fraud losses, and platform fees change over time, and a cost model built during your initial pilot can go stale within a year if you don’t refresh it. Treat your ROI calculation as a living model, updated quarterly, rather than a one-time business case you built to get initial approval.
How Does Loyalty ROI Calculation Differ Across Industries?
A quick-service restaurant, a gym, and an e-commerce retailer all calculate loyalty ROI using the same formula, but the inputs look different enough that copying another industry’s benchmark can mislead you.
For a restaurant, purchase frequency is usually the dominant lever, since the core behavior you’re trying to shift is how often a customer returns in a given month, not how much they spend per visit. A modest frequency lift, say from 1.5 visits a month to 2, compounds quickly across a member base because average transaction values in food service tend to be lower and repeat-friendly.
A gym or fitness studio’s ROI case leans more heavily on retention lift, since the core revenue at stake is a recurring membership fee rather than a per-transaction purchase. Here, the incremental metric that matters most is churn reduction: even a few percentage points of improved month-over-month retention compounds significantly across an annual membership base.
An e-commerce retailer typically sees the clearest AOV and referral effects, since threshold-based rewards (“free shipping over $75”) directly nudge basket size, and social sharing tied to purchases can be tracked through referral codes tied to individual member accounts. That makes the CAC-reduction lever more measurable for online retail than it typically is for a brick-and-mortar service business.
In each case, the formula stays constant: incremental net profit minus program cost, divided by program cost. What changes is which lever you should expect to move first, and which KPI deserves the most scrutiny in your reporting.
Getting Started: A Practical Recommendation
Run the 90-day pilot before you build the three-year model. Pick one segment, one holdout group, and one clear reward structure, then loop in finance early so they help define what “success” means before the data comes in, not after. That single step prevents the most common failure mode: a program that performs reasonably well but gets killed anyway because nobody agreed in advance on the measurement standard.
Track a short list from day one: incremental revenue per member, retention lift versus your holdout, redemption rate, and program cost by category. Report on a biweekly cadence during the pilot and monthly once you scale, and resist the urge to add more metrics than that until you’ve proven the core model works.
— Arturo
Run Your Pilot on a Platform Built for This Exact Playbook
Getrewardqr gives you the lowest-friction way to run the 90-day pilot outlined above, since there’s no app for customers to download and no lengthy technical integration before you can start collecting data. Members scan a QR code, follow your social profiles, and unlock a reward in under a minute, which means your redemption-rate KPI starts generating clean numbers almost immediately instead of weeks into the pilot.
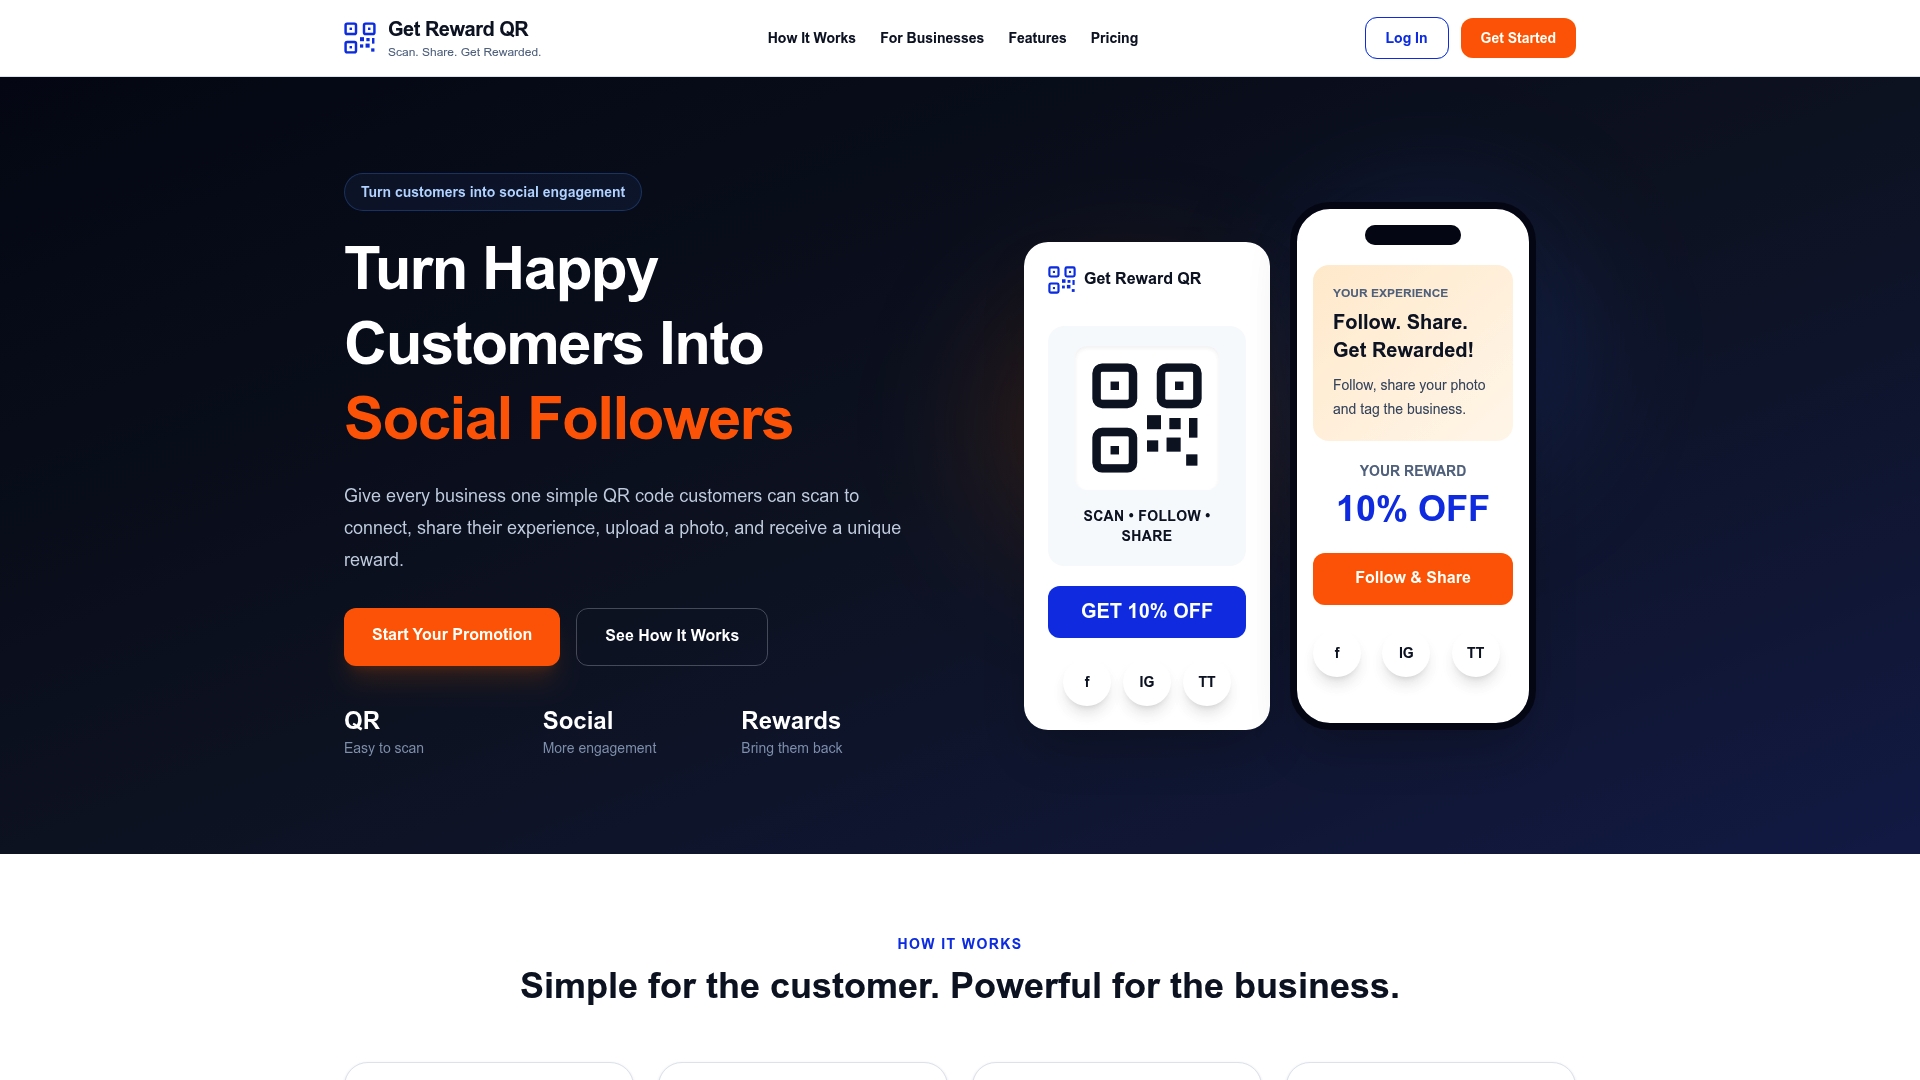
Universal POS mode means staff redeem coupons the same way regardless of what system you run at checkout, which keeps your operations cost line simple to track.
Getrewardqr is priced at $19.99 USD per month or $199 USD per year, either of which comfortably covers a 90-day measurement window without a long-term commitment. If you’re ready to put real numbers behind your loyalty strategy instead of estimates, start your pilot today.
Sources
- EY Loyalty Market Study
- 40 years of loyalty programs: how effective are they?
- Talon
- OpenLoyalty ROI worksheet
FAQ
What Is the Average ROI for Loyalty Programs?
Well-measured programs commonly report ROI in the 20% to 30% range in the first couple of years, with formally tracked programs averaging closer to a 5.2x revenue-to-cost ratio over a multi-year horizon, according to EY and Brandmovers. Treat these as reference points, since actual results vary widely by industry and measurement rigor.
What Is the Average Redemption Rate for Loyalty Programs?
Redemption rates vary significantly by program design and industry, and low redemption is often a friction problem rather than a lack of member interest. Programs that reduce steps between earning and redeeming, the way QR-based platforms like Getrewardqr do, tend to see faster redemption cycles, which research ties to stronger perceived program value.
How Profitable Are Loyalty Programs?
Loyalty programs are typically profitable once you measure incremental net profit rather than gross member revenue, with many programs breaking even between 12 and 18 months and strengthening in Years 2 and 3. Profitability depends heavily on complete cost accounting across technology, rewards liability, operations, and marketing.
How Do You Calculate the ROI of a Loyalty Program?
Use the formula ROI = (Incremental net profit − Program cost) / Program cost × 100, where incremental net profit comes from comparing member spend to a matched control group or holdout, not total member revenue. Talon and OpenLoyalty’s worksheet both walk through this calculation step by step.
Does Getrewardqr Support ROI Measurement for Local Businesses?
Getrewardqr’s campaign analytics track visit frequency, redemption speed, and referral activity, the core behavioral KPIs a 90-day pilot needs to build an incremental ROI case. Current pricing is listed at Getrewardqr.